


Introduction
Anyone who has ever been involved in an SAP BW migration project knows that the larger and more complex the system, the more important it is to be methodical and standardized as much as possible. Migrating from SAP BW to SAP Datasphere also confronts companies with the challenge of switching from their familiar on-premise solution to a public cloud environment. This transformation process requires not only careful planning, but also a clear vision of how to optimally leverage the advantages of the new cloud technology while preserving proven business logic.
SAP BW Bridge is designed for the latter aspect – it acts as a link between the systems and enables the migration of existing models and business logic. In this joint blog post by NextLytics and bluetelligence, we will use a practical example from a project to show how this approach can be successfully implemented. After all, using the bridge naturally means partially foregoing the advantages promised by a greenfield approach in Datasphere. In contrast, as a “faster” migration option, it offers many advantages that are worth considering. The following reasons encourage the use of BW Bridge:
- Investment in BW models: Often, a lot of effort has been expended in the development of specific BW models that contain complex business logic and customized data flows – sometimes with extensive ABAP logic.
- Limited availability of CDS-based extractors: In cases where SAP-based source systems do not yet provide the required CDS extractors (e.g. SAP ECC systems), classic S-API extractors must be used. However, it is not recommended to connect these directly to SAP Datasphere, as there are limitations, for example, when DataSources require mandatory selection fields or certain delta methods are not supported.
- Lack of specific skills: Often, teams have strong BW and ABAP expertise, but not enough knowledge of SQL or Python, which are used in SAP Datasphere, to rebuild the models natively.
All of these factors applied in the following real-life project example. It involved an extensive, historically grown BW system of an energy supplier with highly specialized models that take into account the particularities of the complex and highly regulated energy market. The project objective was to retain the existing models, business logics and data flows and merely map the reporting layer in SAP Datasphere. In this context, the use of the Performer Suite from bluetelligence proved to be a decisive success factor for an efficient and targeted migration.
Vision and Approach
Before we present the detailed objective of the project, it is important to explain a special feature of BW Bridge in connection with SAP Datasphere. Although queries can be transferred to the BW Bridge during migration, they cannot be executed as in the classic BW system or used as a source for other data targets. Instead, queries are provided in the BW Bridge as metadata. This means that they can be imported and used as a basis for the entity import into SAP Datasphere. This feature plays a central role in our approach.
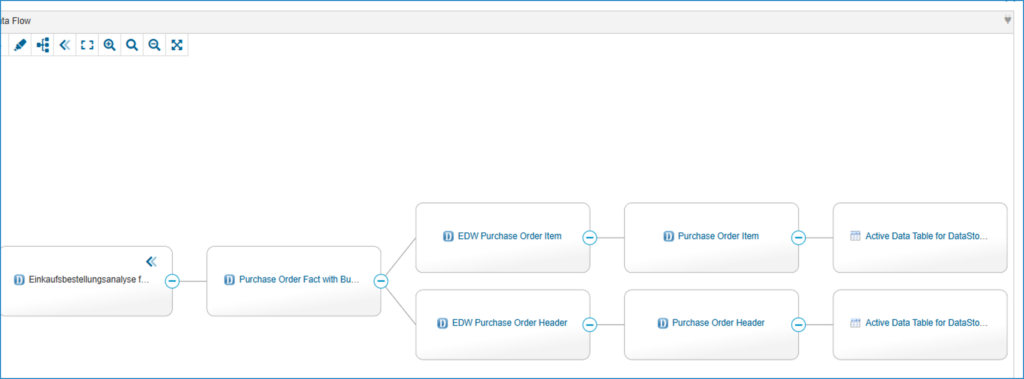
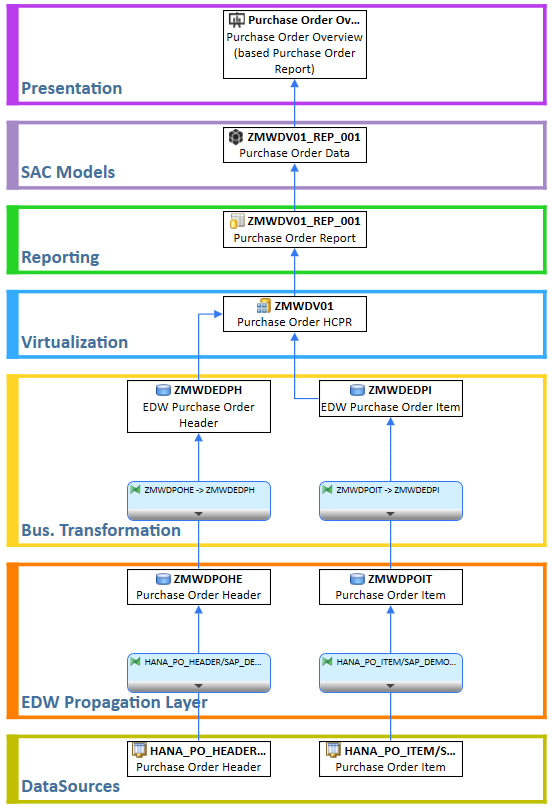
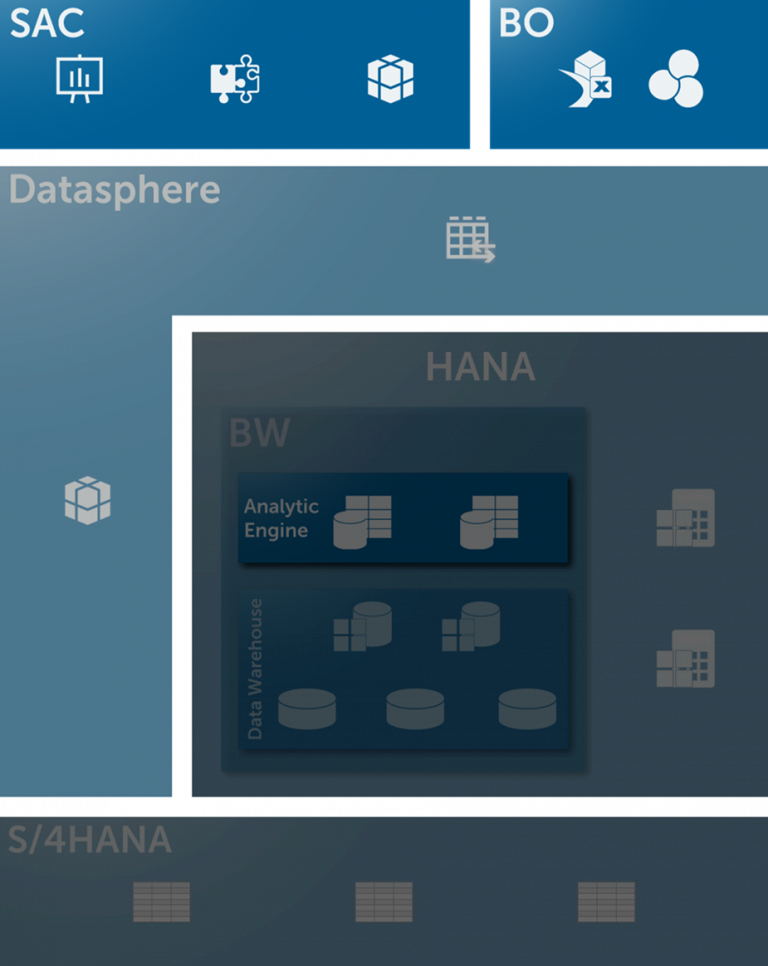
The following diagram illustrates the project’s main objective:
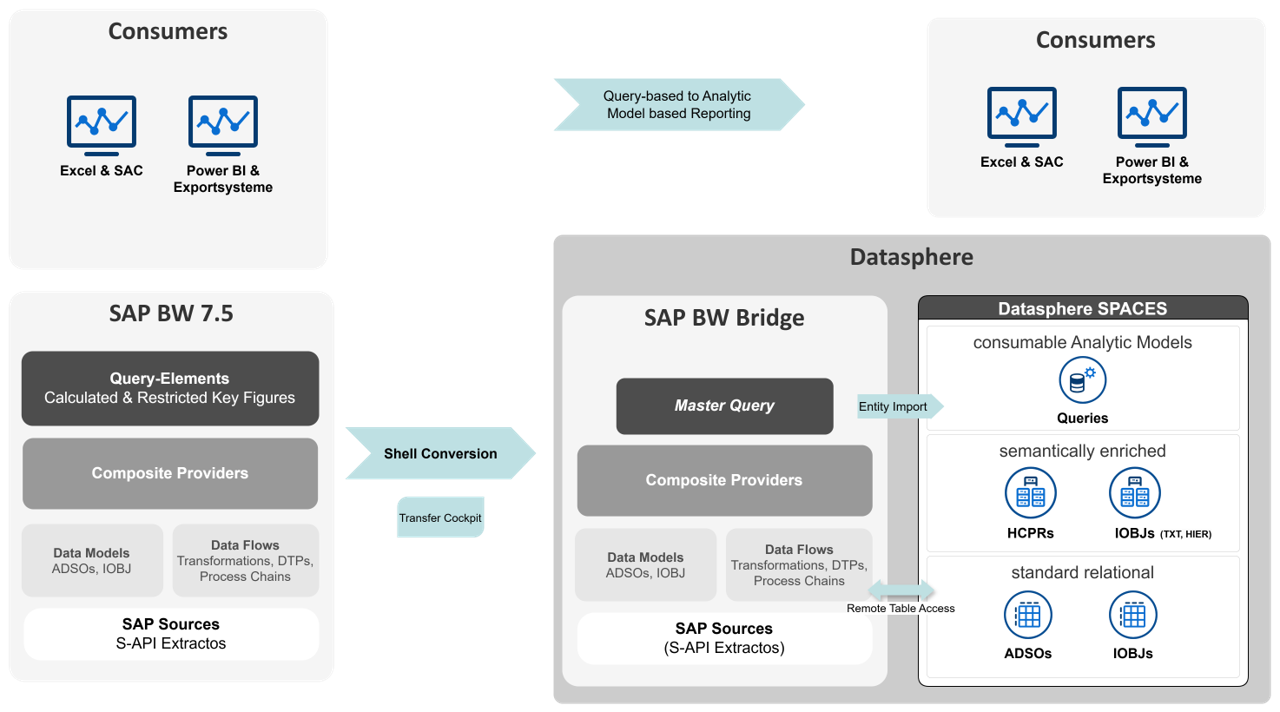
The project defined several key steps that were crucial for the migration from SAP BW to SAP Datasphere:
1.Tool-supported transfer via Shell Conversion:
- Migration of models and data flows up to the composite provider
2. Development and transfer of master queries:
- Mapping of all global and local calculated and restricted key figures as well as all characteristics relevant for reporting
- Creation per composite provider
- Transfer using Shell Conversion
3. Generation of Analytic Models:
- Entity import of the master queries
- automatic creation of the analytics models based on imported queries
4. Conversion of reporting:
- conversion of query-based reporting to analytics models in the various front-end tools
By strategically using entity import, we were able to automatically generate a large number of the required objects and thus significantly reduce the time required for modeling in Datasphere.
The illustration in the diagram is intended to be simplified and focuses on the core aspects of the migration. The complete concept includes additional important components:
- Further non-SAP source systems
- Detailed layer concept
- SPACE concept for the collaboration between central IT and specialist departments
- Implementation of authorizations via data access controls
- Consideration of specific requirements depending on the data recipient (e.g. via ODBC or OData)
For detailed information, please feel free to take a look at our partner’s article on the reference architecture SAP Datasphere: Blog Nextlytics: Datasphere Reference Architecture – Overview & Outlook
Practical Use of the Performer Suite in the Project
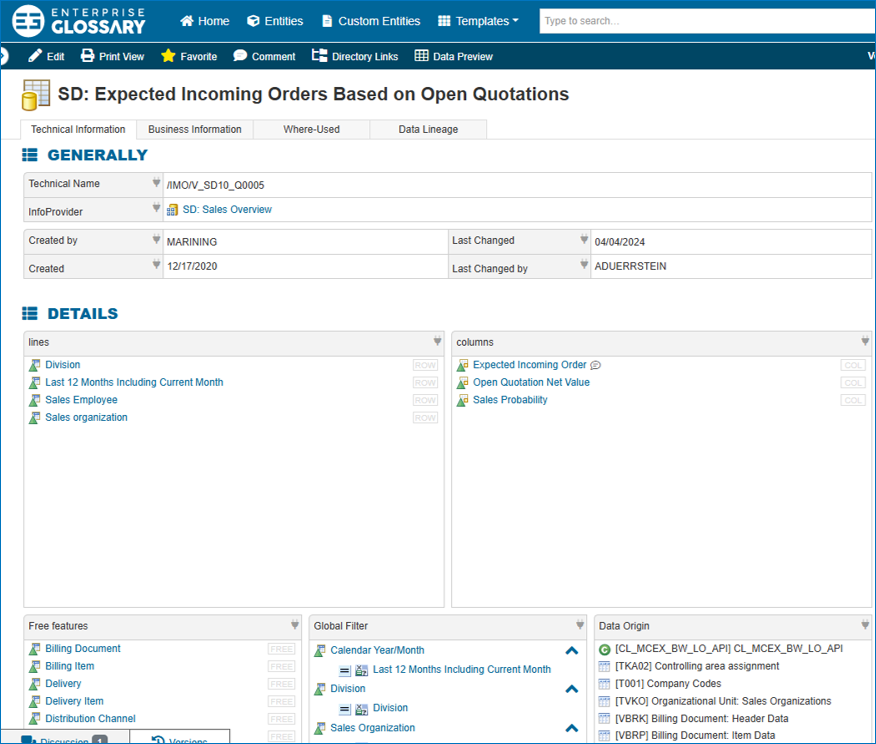
Master Query Analysis
One of the key challenges of the project was to create the key figure definitions as templates for the master queries – to do this, we had to analyze the structures of a large number of queries from the customer’s BW system. Even in the planning phase, it was clear to us that we would need a powerful, tool-supported solution for this. As a partner of bluetelligence, we knew the strengths of the Performer Suite and therefore decided to use a temporary license in the project.
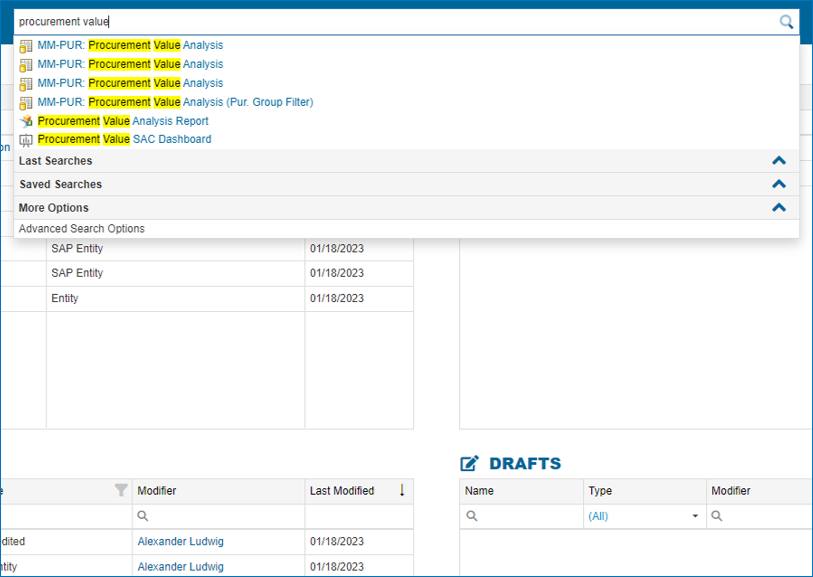
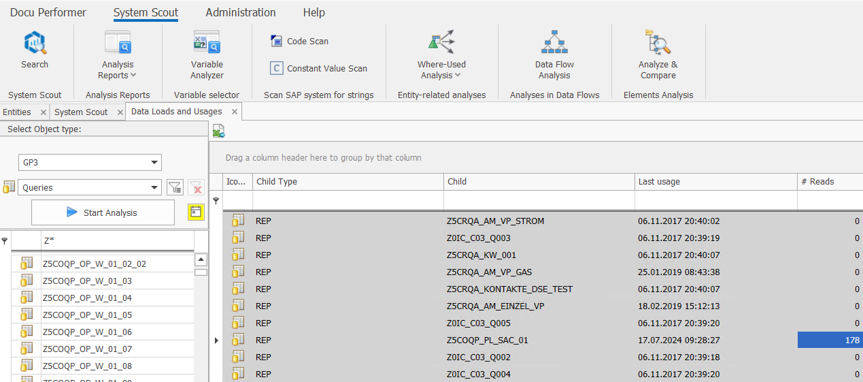
The goal was to create a master query for each composite provider that contains all global and local calculated and restricted key figures as well as all characteristics relevant for reporting. In order to only take over the key figures relevant for reporting, we first analyzed all queries executed in the last 18 months using the System Scout analysis Data Loads and Usages:
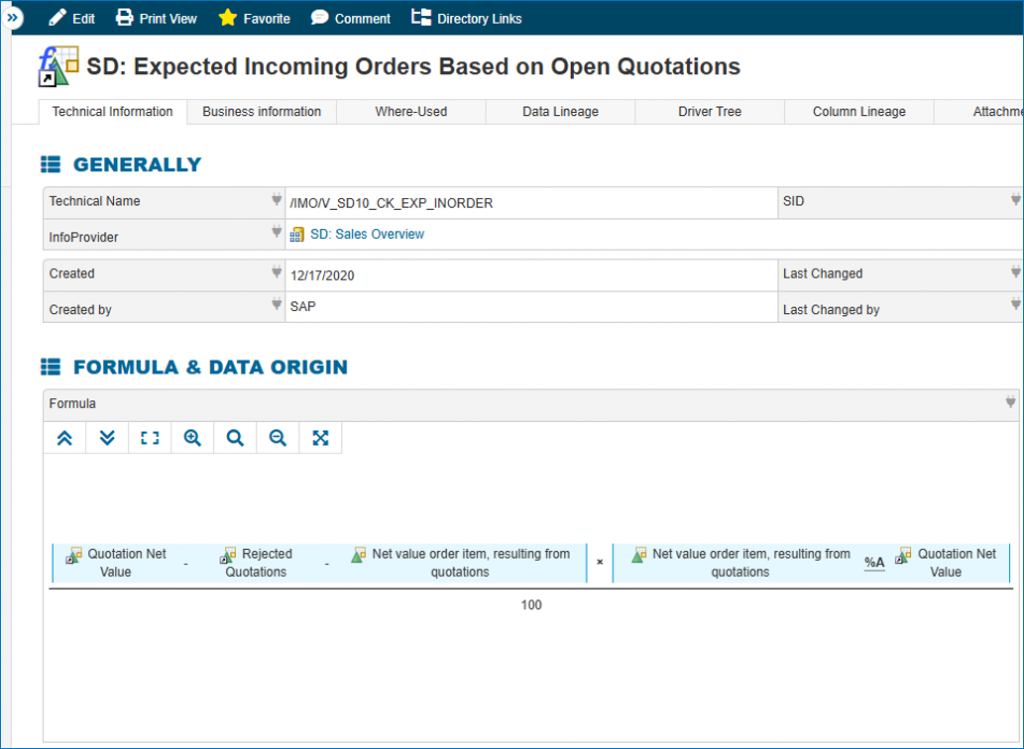
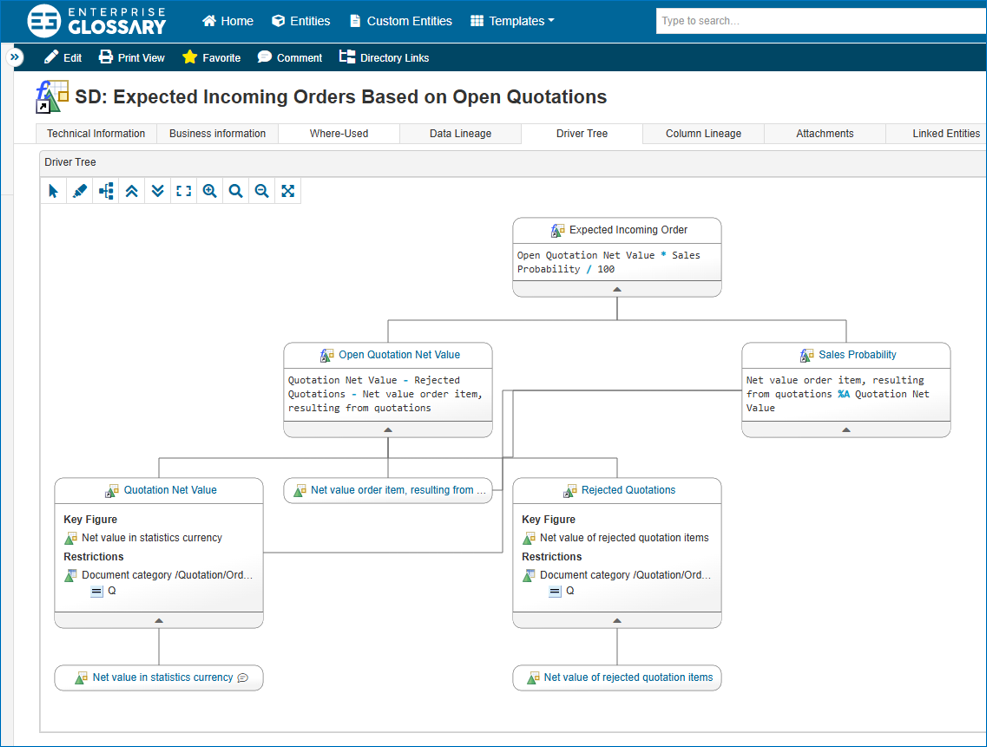
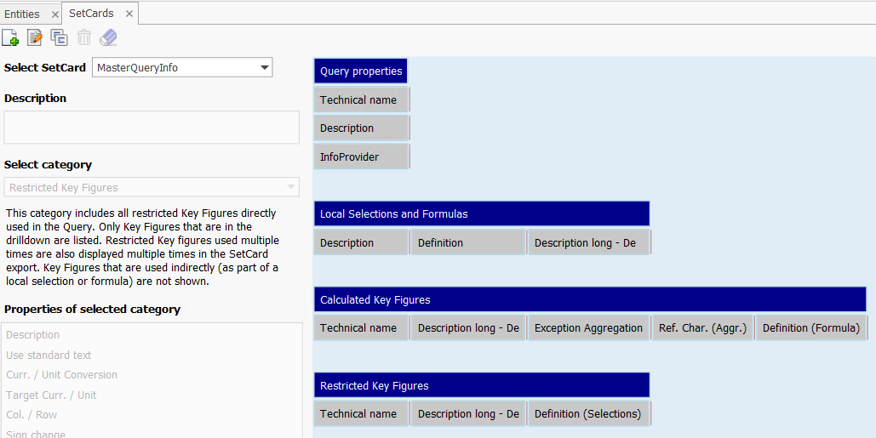
This analysis provided us with a list of all relevant queries for each composite provider. We used the Query SetCard Designer to create a central list of the definitions of all global and local calculated and restricted key figures. We created a SetCard in which we collected all the necessary information on the key figures used in the queries:
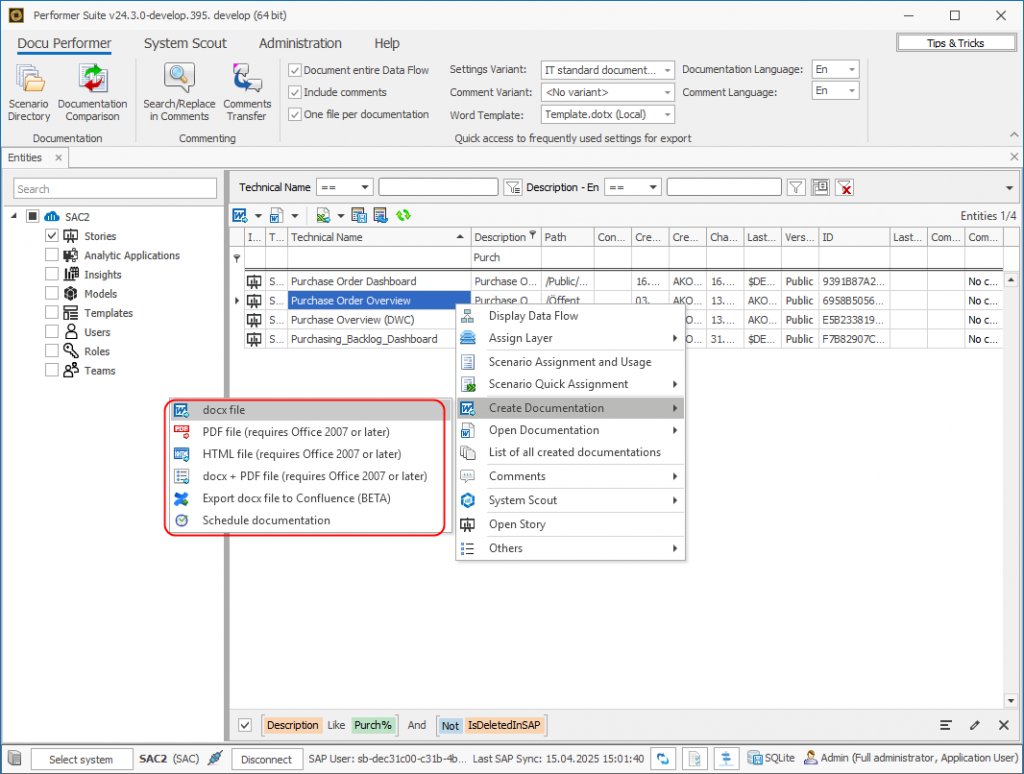
With the help of the Docu Performer (a tool in the suite), we were then able to export the queries to Excel according to our SetCard template. It was important to deactivate the “One file per documentation” setting so as not to create a separate Excel file for each query. The result was a consolidated overview of the key figures for each composite provider. We used this overview as a template for creating the master queries.
Planning of the Migration and Data Flow Analysis
At the beginning of the migration, we developed a structured wave plan that relied on a step-by-step conversion during the project duration, instead of a single big bang at the end. This approach allowed us to iteratively migrate reporting scenarios from SAP BW to SAP Datasphere, test them, and conduct user acceptance tests (UAT) with the departments.
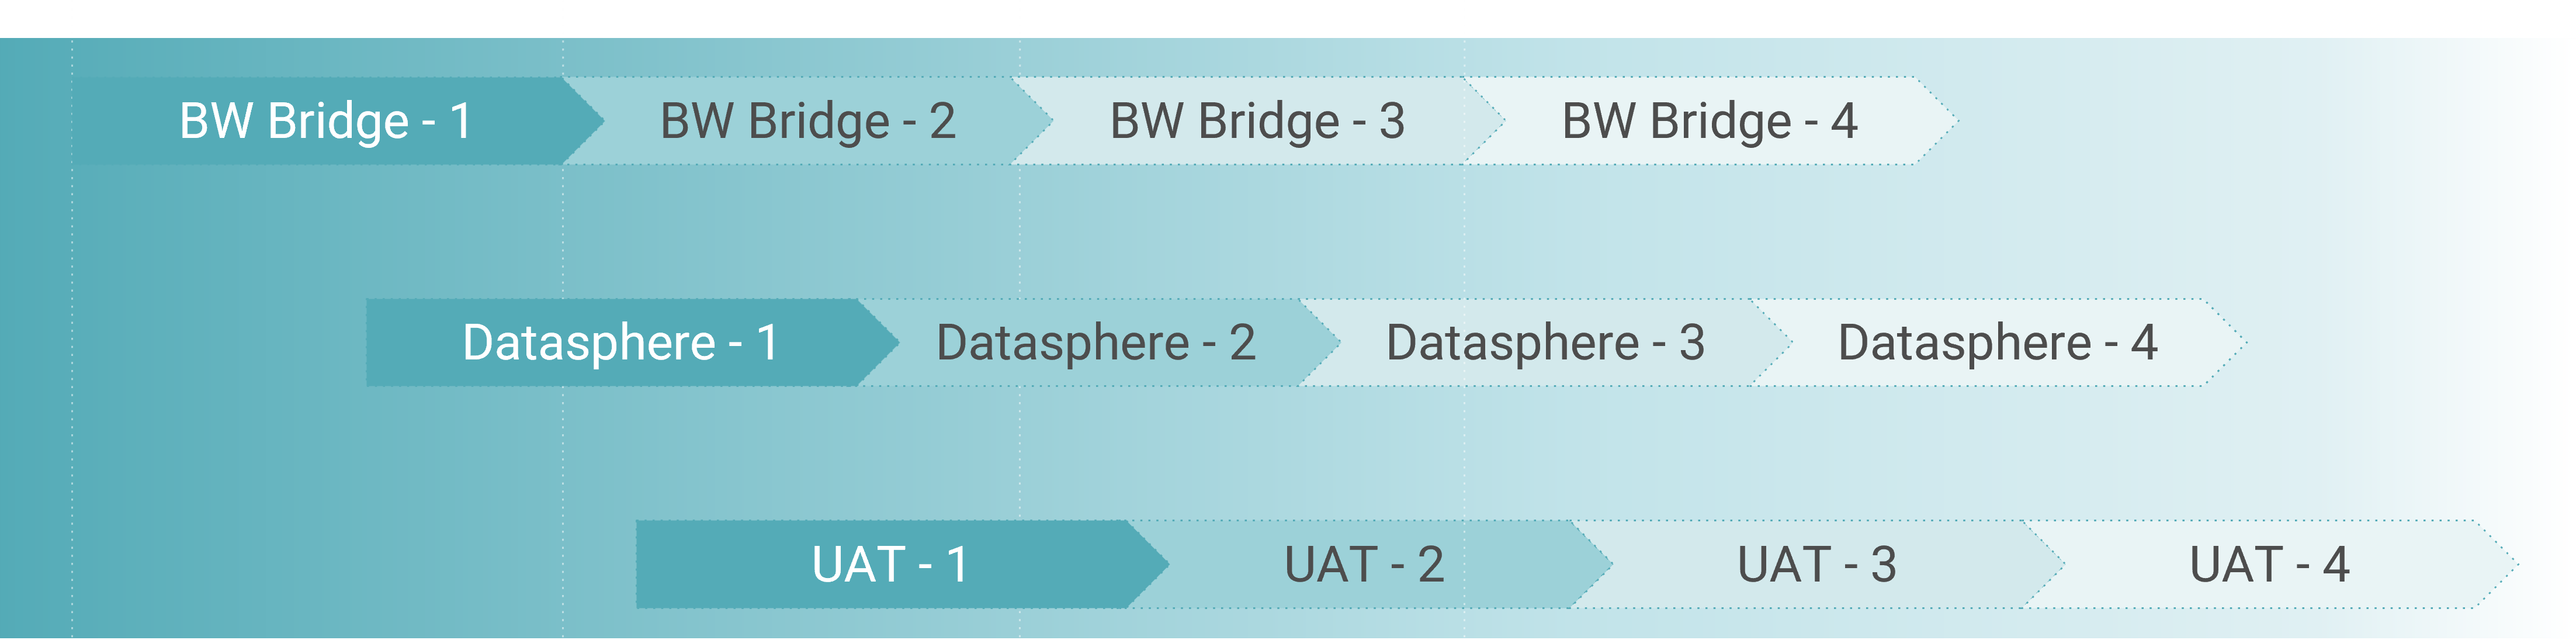

This strategy offered several advantages:
- Risk minimization through step-by-step conversion
- Early stabilization of the new environment
- Continuous learning and optimization of the approach
- Flexibility to respond to challenges without disrupting the overall project
In a first step, the customer split the wave planning at the BW InfoArea level. Based on these specifications, we identified the affected composite providers using the entity lists in the Performer Suite. We created lists of these providers, enriched with additional attributes, and made them available to the customer. This allowed for a precise readjustment of the planning, since not all composite providers from an InfoArea could necessarily be migrated in the same wave due to dependencies.
Our task was to use the BW conversion tool as a shell conversion to migrate the data flows for each composite provider completely and smoothly. Although the conversion tool can determine dependencies itself using a scope analysis, it proved useful to manually spread the objects across several conversion tasks. The automatic scope analysis often returns very extensive object lists, which increases the risk of terminations in the case of complex dependencies. Furthermore, certain dependencies, such as lookups in ABAP transformations, are not automatically recognized.
Our solution was to manually define the scope for each conversion step to achieve better manageability and reduce migration complexity. Based on this approach, we developed the following prioritization for the migration:
- InfoProviders (InfoObjects, aDSOs, Composite Providers)
- Transfer of native DDIC objects via ABAPGit into the BW Bridge ABAP stack (for example, lookups on Z tables in transformations, swapping out routine coding into ABAP classes)
- Transformations
- DTPs and process chains
The DDIC objects had to be manually adapted and activated in the BW Bridge’s BTP ABAP cloud environment. This environment is more restrictive than ABAP Classic and only allows APIs released by SAP. Most existing ABAP developments therefore required significant refactoring.
To create the scope lists, we needed a complete listing of all objects in the data flow, including transformations and DTPs, for each composite provider. We used the data flow analysis in the Performer Suite for this. This enabled us to assign all objects in the data flow to a scenario (in our case, a migration wave).
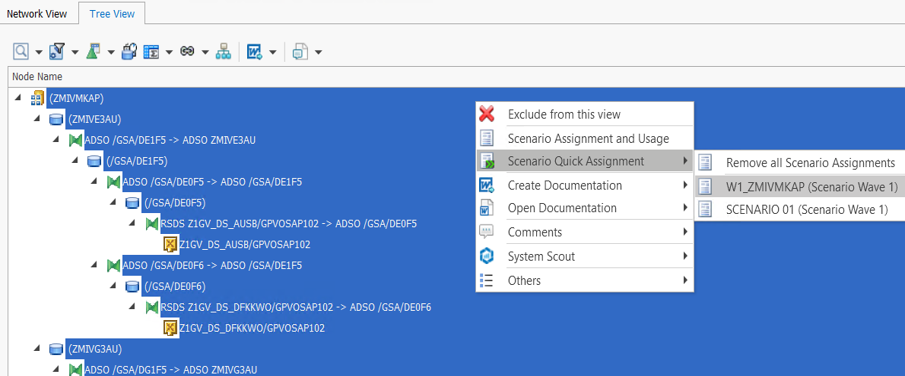
After that, we were able to select all objects in the entity list of the Performer Suite by selecting the corresponding scenario and output them as a list.
These lists served as work lists for the migration and were enriched with additional information (e.g. transformation used ABAP coding) and the migration status. This method allowed us to manage the objects to be migrated for each wave in a transparent and structured way.
Further Possible Uses in the Project
The Performer Suite proved to be a powerful tool in our migration project. Particularly valuable were the easy ways to quickly create lists of BW objects for various purposes.
- For ad hoc analysis, the suite (specifically, System Scout) provided quick insights into data flows that proved to be more detailed and user-friendly than the data flow view in the BW modeling tools.
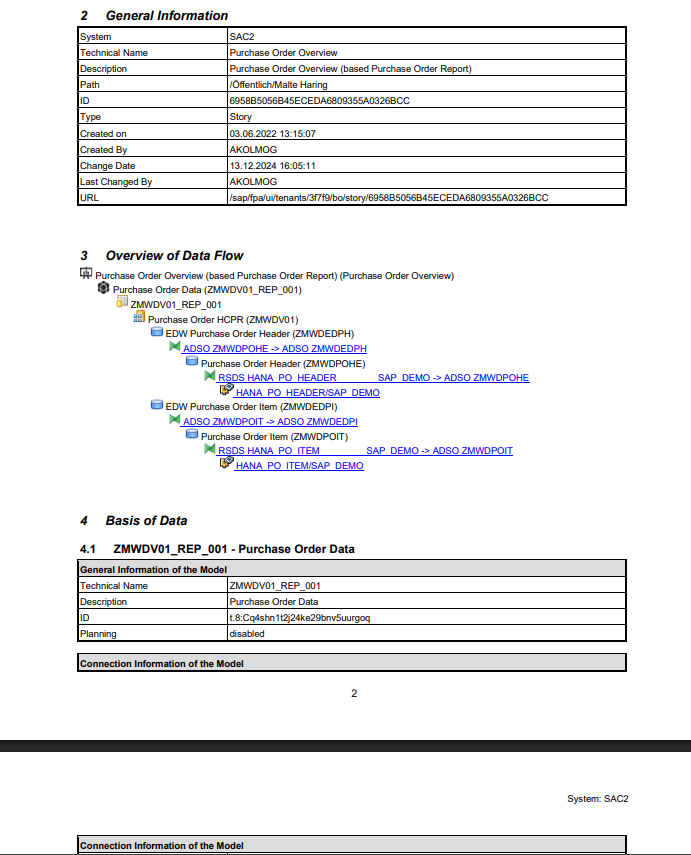
- In cases where models were archived rather than migrated, we used the suite to quickly create complete model documentation.
- For development testing, the suite was particularly useful for quickly determining which InfoProviders were loaded via which process chains. This quick overview helped us to manage the development test process more efficiently.
Challenges and Lessons Learned During the Project
During the project, we did of course also encounter challenges and limitations although we had tool support. These were mainly restrictions on the part of SAP, but there were also possibilities that the Performer Suite does not (yet) offer.
Exporting the query set cards for 3.x query versions proved problematic, which meant that manual checks were necessary. For larger query selections, occasional crashes occurred, so that we had to spread the queries belonging to a composite provider across several export jobs. Consolidating the individually documented queries on a sheet required additional effort, which we managed by developing a macro. A more targeted analysis of all global and local key figures of a composite provider, for example as a system scout analysis, would be helpful in the future.
The major roadblock for our master-query approach was the extensive restrictions on entity import in Datasphere, which are listed in detail in an SAP Note (https://me.sap.com/notes/2932647). The import process was not transparent, as it was not possible to see which problems were occurring and requiring manual corrections. Some features prevented the import completely, others were skipped, resulting in incomplete key figure definitions. Especially critical were the restrictions on the supported formula operators. The limitation to only the basic operations (+, -, *, /) makes the entity import for queries almost unusable in practice. Real queries often have complexities that go far beyond these simple operations. In view of these problems, manual creation of the key figures in Datasphere ultimately proved to be more efficient. We focused the entity import on the composite providers, from which we then created the analytic models, and manually created the key figures in the analytics models. We used the lists of query set cards as a basis, which we had created for the master queries.
When creating the object lists for the migration waves, we encountered another challenge in the Performer Suite: the data flow analysis did not allow a direct assignment of the DTPs to the scenarios. We had to iteratively check the InfoProviders from the scenario in the entity view using the parent column to determine which DTPs belong to which InfoProvider and then subsequently assign them to the scenario. A simpler functionality for the holistic recording of all components of a data flow, including DTPs, without the need for workarounds, would have significantly simplified and speeded up the process.
Summary and Outlook
In summary, we can say that the use of Performer Suite in our project provided enormous value in reducing the manual effort and potential sources of error and in speeding up the entire migration process. The advantage of the project license was that we only had to purchase a temporary license for the specific use case. Our intention was not to integrate the Performer Suite into the daily IT routine, but to use it specifically for our purpose. Therefore, no expert knowledge in all facets of the tool was required.
We are aware that we could have possibly gained even more helpful information from the tool or could have continued working directly with the lists in the tool. Often, we fell back on the traditional method that we often see in customers and that we normally warn of: exporting to Excel, followed by creative further processing of the exported data. But sometimes you just have to be pragmatic! If it was easier for the project participants, who did not all have access to the tool, to work with object lists in the familiar environment of Excel, then that was absolutely fine with us.
In addition to the features already mentioned with regard to key figure and data flow analysis, we still see potential for future enhancements that could further increase the benefits of the Performer Suite in such projects:
- More ABAP-based information in the data flow analysis, especially in terms of ABAP Cloud language syntax. For example, it would be very helpful if the data flow analysis could show which transformations use ABAP coding that is not ABAP Cloud-compatible.
- It is great to see that bluetelligence is investing heavily in the expansion of its analyses in the direction of SAP Datasphere and SAP Analytics Cloud. In addition to views, Analytics Models and Task Chains will also be possible to analyze via the Performer Suite in the future, which will help in migration projects when comparing the old BW world with the new Datasphere world. Unfortunately, with our current version of the tool, we were only able to connect to the old BW system, but not to Datasphere or BW Bridge.
- Of course, it would be ideal if the Migration Booster, which is used as migration support for BW to BW/4HANA, could also be used for BW Bridge projects in the future. Compared to the SAP Conversion Tool, this enables a much more convenient and targeted migration and also allows the assignment of new naming conventions. It is yet to be seen whether SAP will provide the APIs for this on the BTP and whether the market for BW Bridge migrations is large enough to justify such an investment. But maybe it’s not too early to start making wishes – Christmas is coming soon 🙂
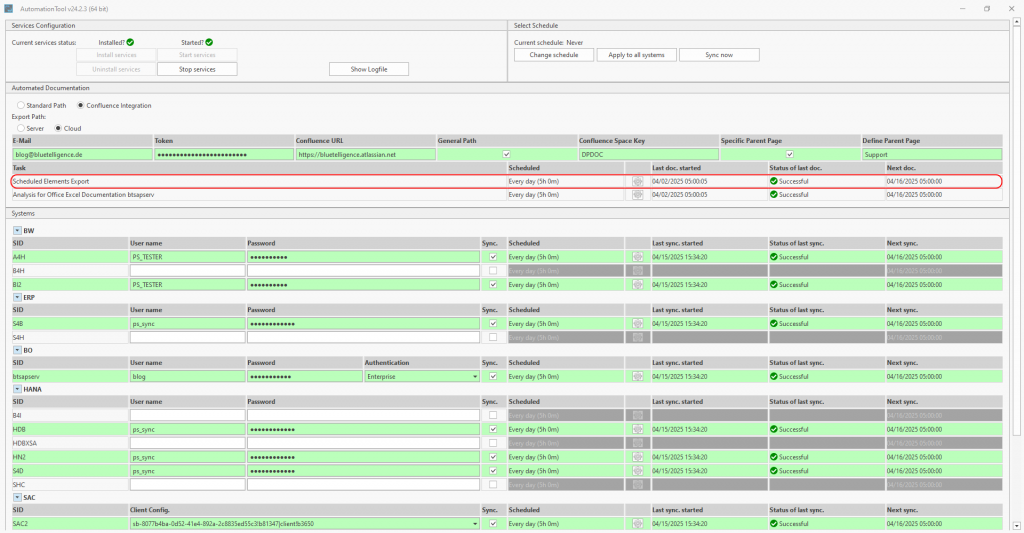
Finally, bluetelligence would like to point out that you can find out more about the tool used for this migration, the tool ‘System Scout’, here:
This article examines challenges and offers solutions in the area of ABAP programming, which serves as the central programming language in the SAP environment. The first part explains the most important aspects around ABAP, including its role in controlling and extending business processes in organizations and the variety of ABAP objects. Then, typical challenges in dealing with ABAP coding in large companies are described. Finally, the opportunity of using automation add-on tools in ABAP development is highlighted. A use case shows how these tools help to analyze and document code structures and dependencies more quickly and precisely.
1. Understanding ABAP Coding: Definition, Classification and Associated Objects
ABAP (Advanced Business Application Programming) is a programming language developed by SAP that is mainly used for the development of applications in the SAP environment. With SAP being the world’s leading company for business software, ABAP is one of the main languages when it comes to controlling and expanding business processes within applications.
Although ABAP was originally procedural, today it also supports object-oriented programming, similar to Java or C++. This makes it easier to implement modern software development principles.
In a large company, the number of ABAP objects (programs, classes, function modules, reports, modules, etc.) can run into tens of thousands. This includes:
- Reports: Programs that are used for retrieving, processing and displaying data (more information can be found here)
- Function Modules: Reusable modules in ABAP that encapsulate specific tasks and are called in programs (more information here)
Forms: User-defined forms such as invoices or delivery bills.
Enhancements: User exits, BAdIs (Business Add-Ins) and other mechanisms for customizing the SAP standard.
2. Mastering Challenges in ABAP coding
Development teams in large companies often struggle with non-transparent dependencies due to the abundance of ABAP coding. This results in errors, increased data model complexity, difficult maintainability and risks during system updates. Below, we’ll explain how these dependencies come about in the first place:

a) Avoid Missing or Insufficient Documentation
One of the most common causes of non-transparent dependencies is inadequate or non-existent documentation. In many projects, the focus is placed on the development of functionality, while the documentation aspect is neglected. However, it is essential to record for “posterity” how different programs, modules and data structures are linked together. Without clearly defined requirements, assigned responsibilities and the continuous updating of documentation, it becomes difficult to recognize dependencies, because: Reverse engineering across multiple system types is extremely time-consuming.
b) Managing Historically Evolved Code
SAP systems and their ABAP codes often exist for many years and are continuously adapted and extended. Over time, more and more user-defined functions, quickly implemented solutions, workarounds and enhancements are created that were originally intended to respond to short-term requirements. Old modules/programs continue to be used even though new solutions exist and changes are sometimes made without taking the overall system into account. As a result, these “evolved” structures are no longer clearly traceable, especially if different internal and external developers or teams have worked on the same programs over the years.
c) Consider Re-use and the Lack of Modularity
In ABAP development, global data and functions are often used that are integrated in many different programs. If developers use global classes, database tables or function modules without defining a clean modularization and clear interfaces, close dependencies arise between different parts of the system. Copying code instead of using common modules also leads to this. These dependencies are often difficult to recognize and are not always documented.
d) Avoid Unplanned and Uncoordinated Adjustments
In larger SAP installations, several developers or teams often work on different data structures and functions at the same time. If these adjustments are made without clear coordination or communication, no versioning is available or code review processes are missing, dependencies can arise that those involved are not aware of. These dependencies then remain opaque until they become apparent due to an error or problem.
e) Correctly Regulate the Use of Dynamic and Indirect Calls
In ABAP, it is possible to use dynamic program calls and indirect accesses to implement generic solutions (e.g. dynamic function calls or SELECTs to tables whose names are only determined at runtime). Metadata or tables are also sometimes used at runtime to control program sequences. Such techniques can be useful for developing flexible solutions, but they make the code less comprehensible. Without clear references to the dependent modules, it becomes more difficult to understand which programs or data structures are actually being used.
f) Mind the Close Connection Between User-defined and Standard SAP Components
“User exits”, “enhancements” or “modifications” to extend the SAP standard are commonplace. These user-defined developments (Z programs, enhancements) are often strongly linked to the SAP standard. When changes are made to the standard (e.g. through an SAP upgrade or a support package), unforeseen dependencies can arise because the programs are closely interlinked in a way that is not transparent. The close links between user-defined enhancements and the SAP standard can be difficult to understand.
g) Do Not Neglect Tests and Quality Controls
If the code is not sufficiently tested or checked, dependencies can be overlooked. Tests, especially unit and integration tests, often uncover hidden dependencies caused by changes in a module or program. If such tests do not take place or are inadequate, these dependencies remain undetected for a long time and changes are put into production with errors. This aspect is therefore due to a lack of quality assurance processes.
3. Tool Support: Automated Transparency in ABAP Coding
As described above, the challenges with ABAP coding are many and varied and involve a lot of effort in terms of documentation, coordination and quality assurance. SAP add-on tools can automate these processes: They document, can quickly search and adapt the code, facilitate testing and offer collaboration functions for both internal and external stakeholders.
A specific use case will help you to visualize the use of such tools in everyday working life:
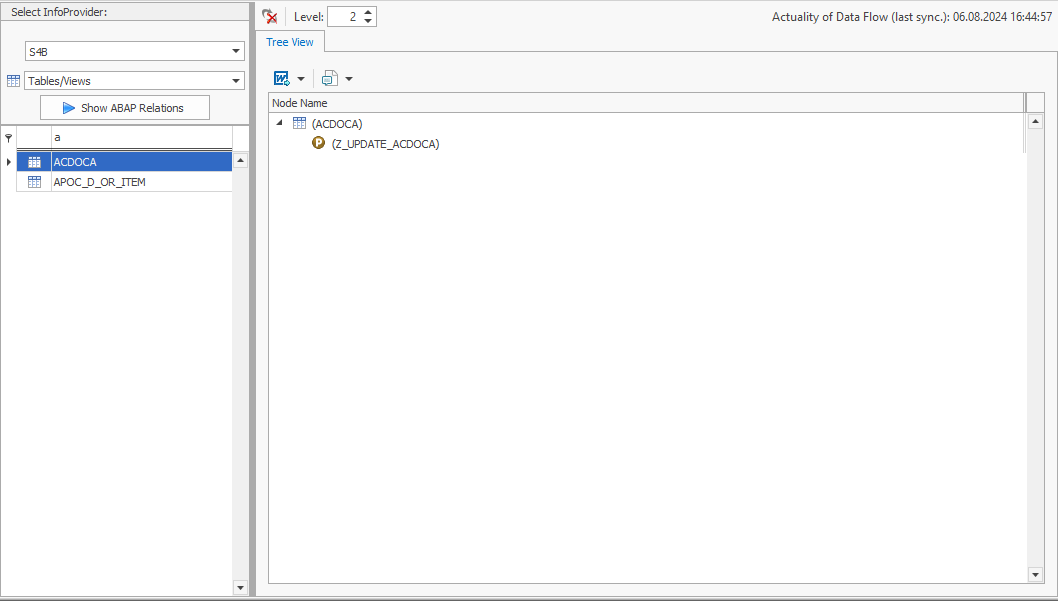
You are an ABAP developer. For some time now, you have been wondering why the record type for company code 2000 in table ACDOCA is always set to Planned. Unfortunately, you no longer have access to the original developers who implemented these processes because they have long since left the company. You are therefore faced with the challenge of determining the origin of the data in this table without any tips or documentation.
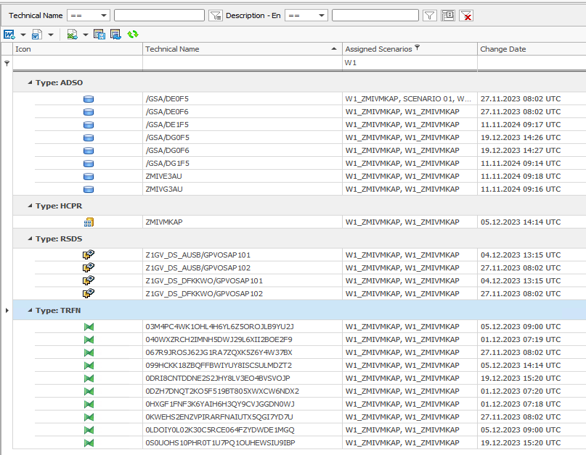
Instead of laboriously combing through the SAP BW backend and manually searching for the relevant ABAP objects, use an SAP add-on tool that can automatically search through metadata and put it into context. One such tool is our “System Scout” software, for example. Using its “ABAP Relations” function, you can analyze relationships between various ABAP objects and the ACDOCA table at the touch of a button. This is how you discover that the Z_UPDATE_ACDOCA program manipulates the ACDOCA table.
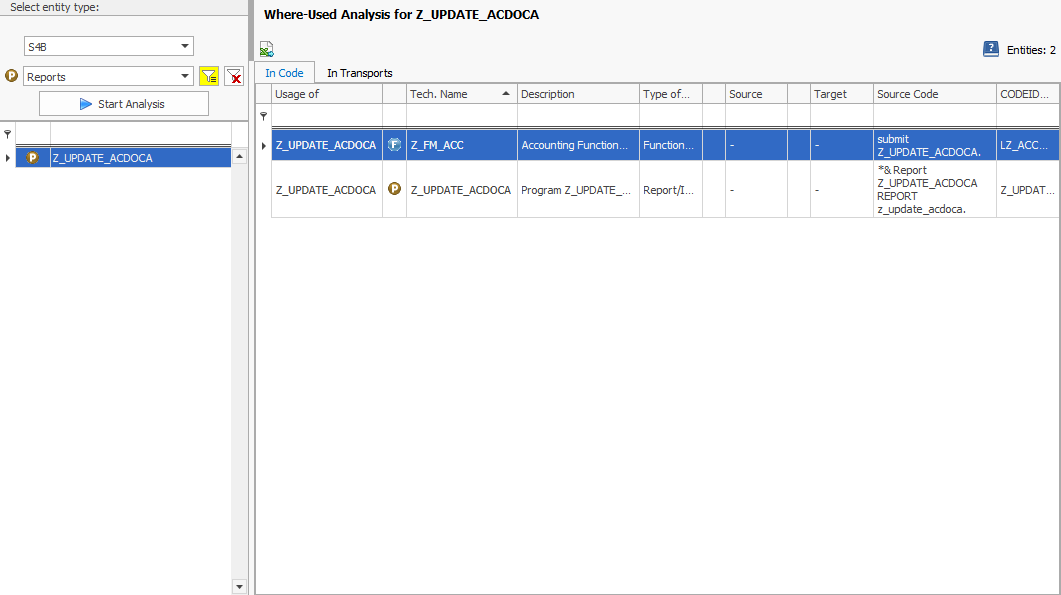
INSERT, MODIFY, UPDATEand DELETE But you require even more information: It is important for you to know which ABAP objects trigger the data manipulation. Here, too, the tool offers a helpful function: the where-used list. It carries out this analysis for the program Z_UPDATE_ACDOCA and finds out that this program is referenced in the function module Z_FM_ACC:
Knowing where to look for the logic responsible for the record type plan will save you valuable time if you have a full to-do list and no documentation.
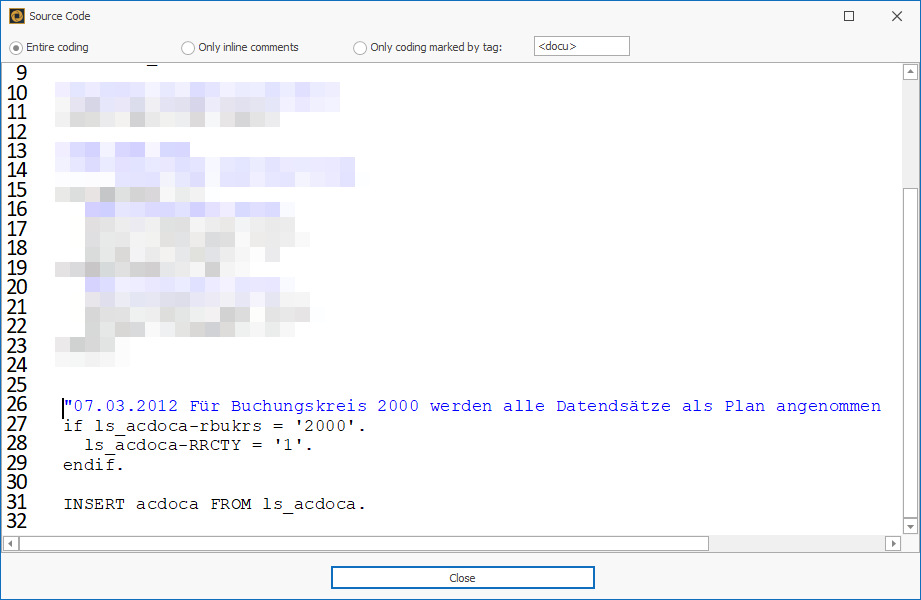
After the automated analysis of the source code, you also find out that a very old logic from 2012 always sets the record type for company code 2000 to planned.
Incidentally, apart from the use case listed in the classic ABAP environment, the “ABAP Relations” function also supports you in the BW environment. If a lookup scan is carried out in a BW data flow, the identified objects can then also be analyzed with “ABAP Relations”:
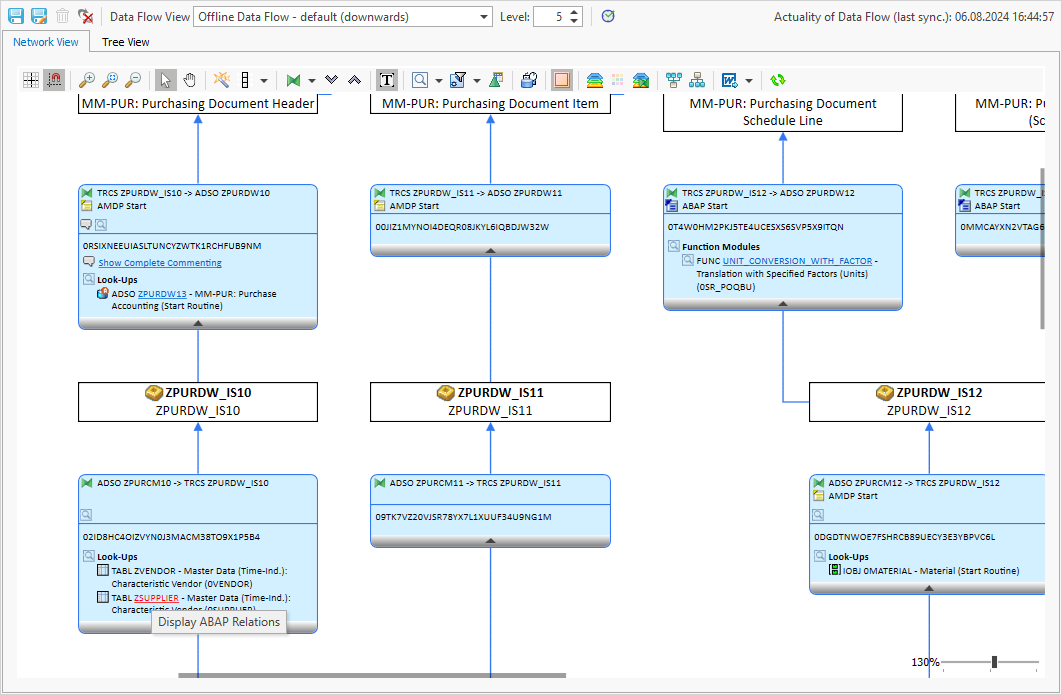
For example, you can see that the table ZSUPPLIER is manipulated by a program – namely Z_UPDATE_SUPPLIER:
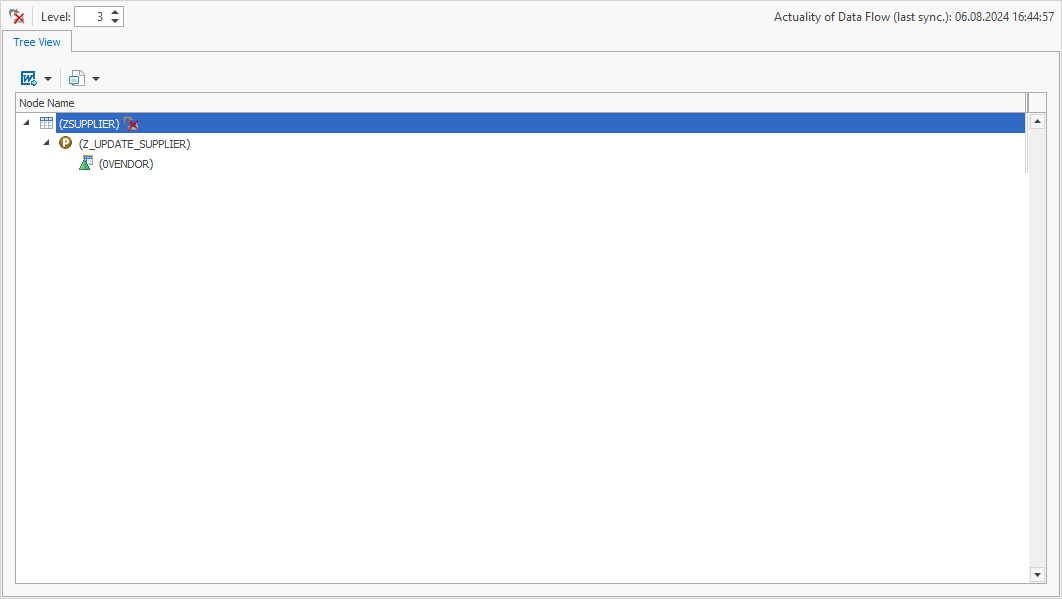
In addition, identified tables of BW objects are displayed directly as BW objects. This ensures a better understanding and enables further interactions and analyses.
The functions of the System Scouts tool, in particular “ABAP Relations” and the where-used list, offer considerable advantages to ABAP developers who need to quickly understand complex data flows:
They provide a quick overview of data manipulations and their origin, save time and increase the accuracy of analyses.
By clearly displaying the relationships between different ABAP objects and tables, these functions create transparency and make work considerably easier.
In addition, support in the BW environment makes the entire data flow analysis in SAP systems even more efficient and easier to understand.
P.S.: Nobody stays in their job forever – so don’t forget to document ABAP objects and their relationships for posterity. There is also an SAP add-on tool that automates this – the Docu Performer. It ensures that future ABAP developers no longer have to research, but can directly access detailed and up-to-date documentation.
Collaboration is a crucial driver of success, especially in complex domains like the Business Intelligence (BI) of a corporation. That’s because collaboration allows pooling the knowledge and skills of employees and work more efficiently together. That way, the BI team can respond to changes more quickly, act more flexibly, and ultimately positively influence their corporation’s outcome and competitiveness.
Now, what requires collaboration in a BI work context, exactly? The everyday tasks and decisions of any BI employee involve charts and reports. Most BI departments use high-end software solutions to make them accessible and offer a deeper insight. Yet, many face low use and acceptance among their teams. Collaborative BI boosts the acceptance of BI software and simultaneously changes how we handle data analysis and decision-making – by promoting teamwork and combining everyone’s knowledge. Here’s how:
1. Understanding Collaborative BI
In order to get a deeper understanding of Collaborative BI, let’s have a look at the ‘old’ way, before this trend: Traditional Business Intelligence follows a centralized, IT-driven model where a specialized team of analysts produces static, historical reports for decision-makers, often leading to extended turnaround times for fresh insights.
Now, on the other hand, Collaborative BI enables a wider array of users throughout the organization to interact with dynamic, real-time data using self-service tools that diminish reliance on IT. This method and its corresponding tools promote improved collaboration through functionalities such as report sharing, commenting, and annotating, while emphasizing both real-time and predictive analytics to facilitate proactive decision-making.
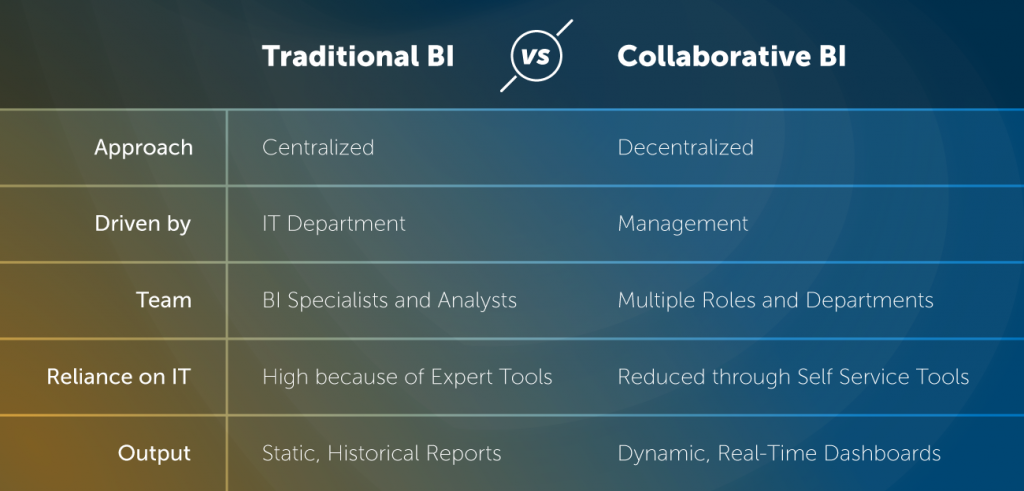
Traditional BI versus Collaborative BI
Key Objectives of Implementing Collaborative BI
The primary aim of Collaborative BI is to enhance problem-solving and decision-making processes. The following aspects are fundamental to achieving this overarching goal:
Decentralized Analysis
By engaging and empowering a diverse range of users with various roles, backgrounds, and skill sets, organizations can tap into a multitude of perspectives and collective intelligence. This approach helps in mitigating bottlenecks that are traditionally linked to centralized teams, thereby expediting the process of problem-solving. Engaging users from diverse departments and backgrounds fosters a rich array of viewpoints and insights, ultimately resulting in more thorough and inventive solutions.
Improved Dashboard & Report Design
Users with diverse roles, backgrounds, and skill levels require customized dashboards and reports that align with their specific needs. By fostering the sharing of ideas and knowledge among these users, organizations can create tailored dashboards and reports that effectively meet the varied requirements of their audience. Moreover, real-time access to data enables users to quickly identify and address issues as they arise. Interactive dashboards and reports allow users to drill down into data, uncovering root causes and patterns more quickly than with static reports.
Collaboration Tools & Services
Collaborative BI tools provide features such as commenting, sharing, and discussion threads facilitate immediate communication and collaboration among team members, allowing for faster consensus and action. Seamless real-time data sharing across the organization ensures that all relevant stakeholders have access to the same information, fostering a unified approach to decision making. Self-service BI tools enable users to generate their own reports and queries without waiting for IT support, accelerating the decision-making process.
2. Challenges in Implementing Collaborative BI
The implementation of Collaborative BI presents a unique set of challenges, which can differ based on the organization’s initial position and current circumstances. Overcoming these challenges will ensure the success of your Collaborative BI implementation.
- Tool Elasticity
- Data Privacy, Security and Data Ownership
- Metadata
- Data Integration
- Communication between Employees

Tool Elasticity
Tool elasticity, meaning the ability of BI tools to scale and adapt to varying user needs and workloads, poses a challenge for implementing collaborative BI as well: Ensuring scalability without performance degradation, integrating with existing systems, managing variable costs, and facilitating user adoption across all skill levels require significant effort. Additionally, data security concerns, especially with cloud-based solutions, performance optimization, maintaining consistent and reliable access, and balancing customization with stability complicate the process. These factors make it difficult for organizations to effectively implement and maintain elastic BI tools for collaborative efforts.
Data Privacy, Security & Data Ownership
Data privacy, security, and data ownership of course pose challenges when implementing collaborative BI: Handling sensitive information, managing authorized usage, ensuring compliance with regulations like GDPR and HIPAA, and managing the increased risk of data breaches is complex and critical. Additionally, implementing robust security measures and secure infrastructure require significant investment and expertise. Continuous user training and awareness programs are essential to minimize human errors that could compromise data security, further complicating the implementation of collaborative BI.
Metadata
Metadata is extremely helpful in the context of collaborative BI because it answers the questions of data origin, usage. In traditional BI, these questions are asked by business departments and answered by IT. In collaborative BI, business users find answers themselves. This, however, presents the challenge of ensuring data is correctly understood by less tech-savvy users and utilized across the organization – e.g. by comprehensive training. Additionally, metadata is only of use for correct analyses when it is maintained up-to-date – this involves a significant effort and constant documentation of data sources, definitions, structures, and usage. Discrepancies in metadata can lead to misinterpretations and inconsistencies, complicating data sharing and collaboration.
Data Integration
Data integration is particularly challenging and crucial for Collaborative BI: It involves consolidating different data sources with varying formats, structures, and quality levels into a unified system that all users can access and analyze. It is essential for enabling real-time, collaborative decision-making, but it requires sophisticated tools and processes for data extraction, transformation, and loading (ETL). Effective data integration also necessitates collaboration between IT and business units to align on data definitions and standards, a challenging but essential task to ensure that all users are working with the same accurate and consistent data.
Communication between Employees
Communication between employees is the heart of the whole matter of Collaborative BI – and it is a challenge itself: Due to the varying levels of (technical and business) expertise and understanding of data, differences in language, priorities, and perspectives, misunderstandings are bound to occur. They can lead to incorrect data interpretations, flawed analyses, and poor decision-making. Additionally, coordinating across departments and ensuring that everyone is aligned on BI objectives, processes, and tools necessitates continuous effort. Implementing these channels and fostering a culture of open communication requires ongoing commitment from leadership to break down silos and encourage active participation from all employees.
3. Recommendations for Improving Collaboration in Your Existing BI Landscape
Collaborative BI may pose its challenges, but with the following recommendations, you will eventually overcome and even outweigh them with its striking benefits:
- Self-Service & Data Visualization
- Data Quality & Data Governance
- Metadata Management & Data Cataloging
- Culture & Communication

Self-Service & Data Visualization
Self-service and data visualization are key when it comes to Collaborative BI – both aspects take the weight of the IT departments’ shoulders and make data accessible and understandable to all departments. They materialize in the form of
- intuitive, user-friendly tools that empower employees of all skill levels…
- …to access, analyze, and visualize data independently, fostering a data-driven culture across the organization
- comprehensive training to ensure the usage and efficiency of these tools
- Enhancing data visualization with customizability allows users to tailor dashboards to their specific needs and easily share findings with colleagues
- Ensuring robust data governance and real-time data access will further enhance the reliability and relevance of the insights generated.
Encouraging feedback and continuous improvement of these tools based on user experience helps to keep them aligned with the evolving needs of the organization.
Data Quality & Data Governance
A second big necessity in the process of introducing Collaborative BI is improving data quality. It can be achieved by implementing strong data governance practices:
Establishing
- standardized data entry protocols,
- regular data cleaning
- validation processes
- and clear data ownership that ensures accountability among all stakeholders
is essential to maintain high-quality data.
Advanced data management tools even automate error detection and correction and can significantly reduce inconsistencies. Ultimately, the culture of transparency with Collaborative BI fosters an open communication about data issues and collective efforts to resolve them, even if done manually.
Metadata Management & Data Cataloging
Finally, metadata management and data cataloging are an essential aspect to facilitate Collaborative BI. Ideally, you can even combine the two of them: Via APIs or dedicated metadata repositories, it is possible to include SAP or Power BI metadata into or next to your Data Catalog.
When implementing a data catalog, make sure that it
- serves as a centralized access to every BI employee (single point of truth)
- provides an intuitive interface and displays data in straight-forward way, so that users with varying backgrounds are able to comprehend the information
- includes metadata like the usage, source and lineage of data in order to efficiently answer questions that arise in the context of reporting
- displays up-to-date metadata in order to make the single point of truth really true – and thus, boost the usage of the Data Catalog
Continuous training and support for employees on the importance and use of metadata further enhance their ability to contribute to and benefit from the collaborative BI efforts, ultimately leading to more informed and effective decision-making.
Culture & Communication
Last, but not least, people make a company. In order to foster the new collaborative culture, management should:
- prioritize transparency and actively encourage the sharing of information and insights across all levels of the organization.
- Implement regular training sessions and workshops to enhance data literacy, ensuring all employees feel confident in their ability to contribute to BI initiatives
- Recognize and reward teamwork and collective problem-solving
- additionally, the physical aspect of creating dedicated collaboration spaces will streamline communication and data sharing, making it easier for teams to work together effectively
4. Collaborative BI Tools: Data Catalog meets Metadata Repository
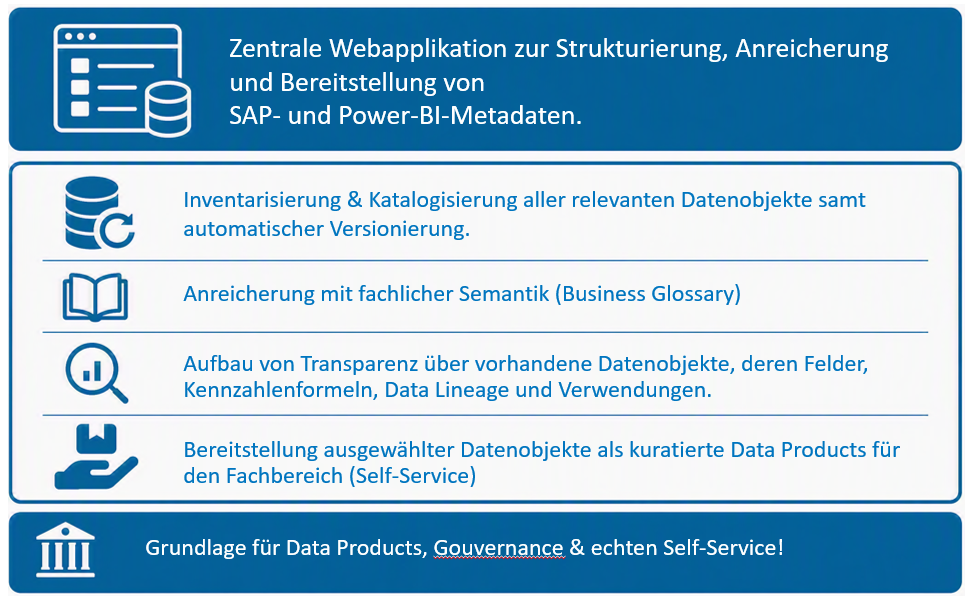
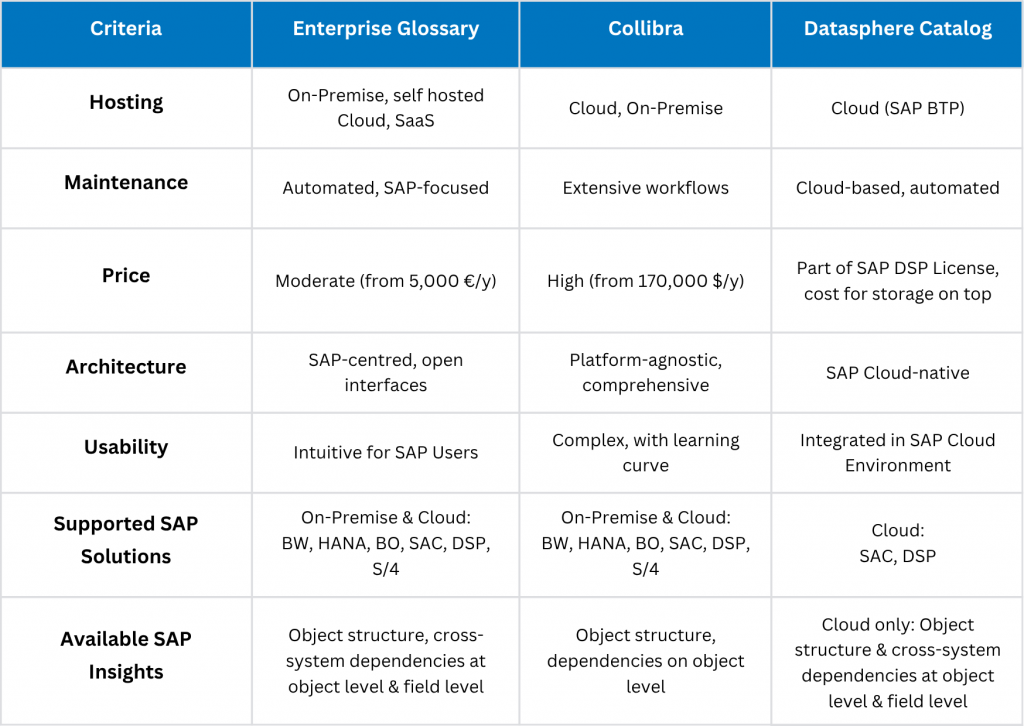
As described above, user-friendly Data Catalogs and Metadata Repositories are two crucial tools to enhance Collaborative BI in your company. As a BI software development company of 16 years, bluetelligence has developed a combination of both: Our Data Catalog “Enterprise Glossary” includes business information as well as automatically synchronized metadata of all connected SAP and Power BI systems. It checks all the boxes of driving Collaborative BI by
- providing a central access to all key figures and reports in the company
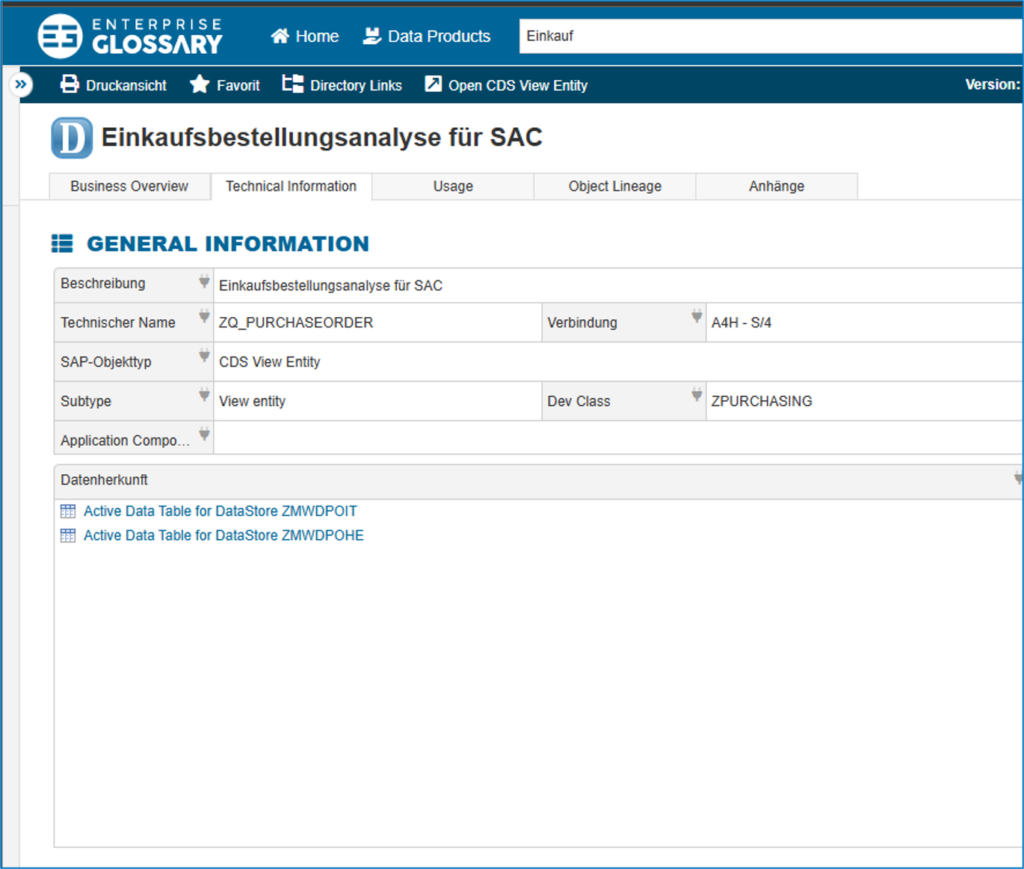
- including information for all knowledge levels: business definitions as well as technical metadata (data source, data lineage, related key figures, etc) in an understandable way
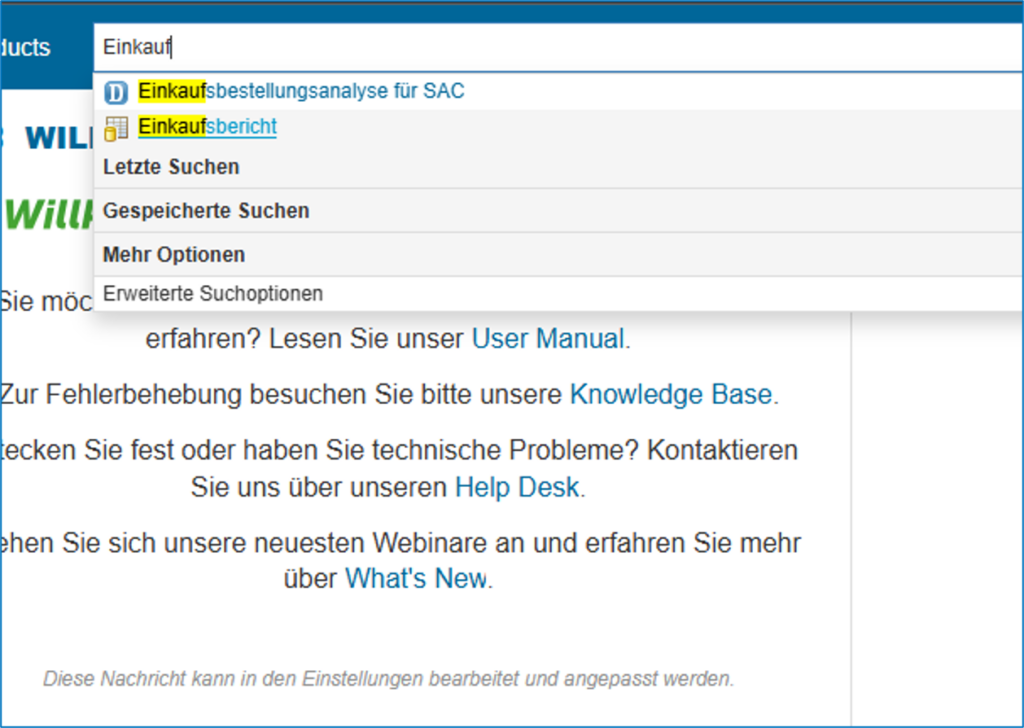
- offering a user-friendly search and intuitive interface
- automatically syncing all connected SAP & Power BI systems for up-to-date information
- providing communication features for remarks and discussions
- being able to use standard templates or customize it to your needs entirely
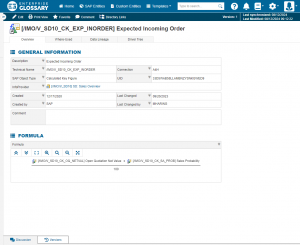
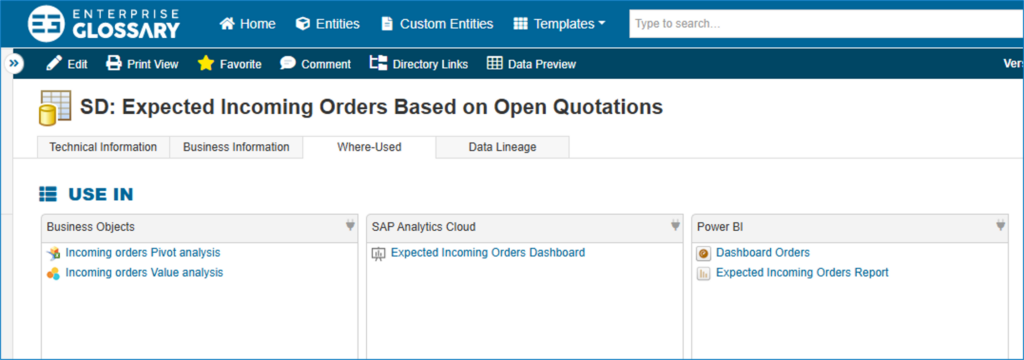
Glossary Entry Data Catalog
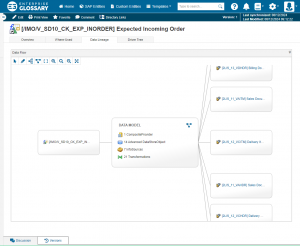
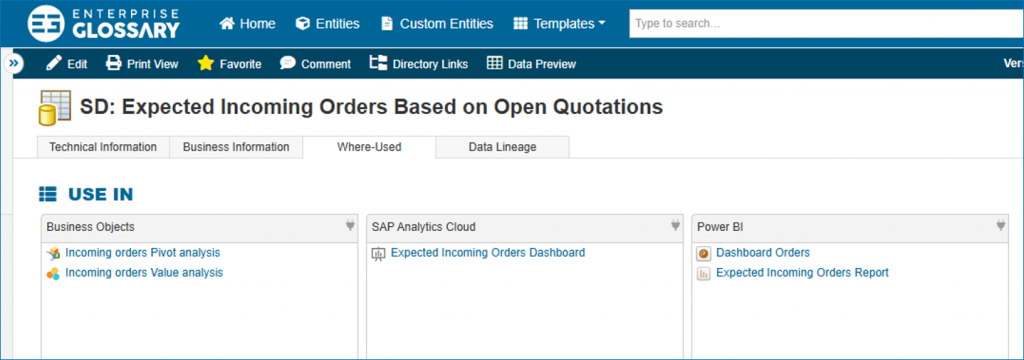
Data Lineage in the Data Catalog
Overall, bluetelligence empowers your company to leverage metadata more effectively, driving innovation and improving business outcomes through enhanced collaboration. Read more about our data catalog, the Enterprise Glossary, on www.enterprise-glossary.de/en.
Should you already utilize a Data Catalog but are looking to include SAP or Power BI metadata, our API serves this purpose exactly. In this case, head to www.bluetelligence.de/en/metadata-api.